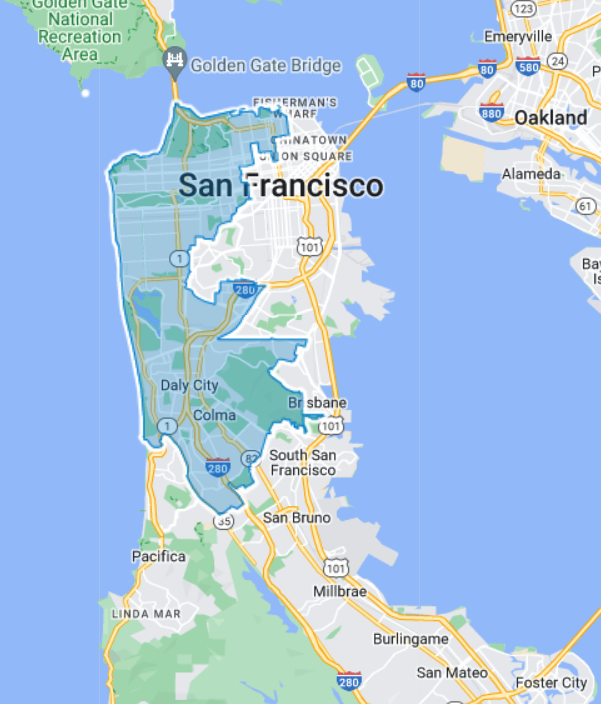
District Map
DISTRICT AD19
2020 Census Population (adj Elec. §21003)
| Name | Count | Percent |
|---|
| Total Population (POP) | 503,871 | 100.00% |
|---|
| POP Hispanic or Latino | 73,494 | 14.59% |
|---|
| POP Not Hispanic or Latino (NH) | 430,377 | 85.41% |
|---|
| POP NH Population of one race | 405,105 | 80.40% |
|---|
| POP NH White alone | 175,635 | 34.86% |
|---|
| POP NH Black or African American alone | 12,733 | 2.53% |
|---|
| POP NH Asian alone | 210,401 | 41.76% |
|---|
| POP NH American Indian and Alaska Native alone | 575 | 0.11% |
|---|
| POP NH Native Hawaiian and Other Pacific Islander alone | 1,810 | 0.36% |
|---|
| POP NH Some Other Race alone | 3,951 | 0.78% |
|---|
| POP NH Population of two or more races | 25,272 | 5.02% |
|---|
2020 Census Housing Occupancy Status
| Name | Count | Percent |
|---|
| Total Housing Units | 206,174 | 100.00% |
|---|
| Occupied | 192,053 | 93.15% |
|---|
| Vacant | 14,121 | 6.85% |
|---|
2020 Census Group Quarters Population (adj Elec. §21003)
| Name | Count | Percent |
|---|
| Total Group Quarters Population: | 7,778 | 100.00% |
|---|
| Institutionalized population: | 1,366 | 17.56% |
|---|
| Correctional facilities for adults | 0 | 0.00% |
|---|
| Juvenile facilities | 82 | 1.05% |
|---|
| Nursing facilities/Skilled-nursing facilities | 1,251 | 16.08% |
|---|
| Other institutional facilities | 33 | 0.42% |
|---|
| Noninstitutionalized population: | 6,412 | 82.44% |
|---|
| College/University student housing | 3,629 | 46.66% |
|---|
| Military quarters | 0 | 0.00% |
|---|
| Other noninstitutional facilities | 2,783 | 35.78% |
|---|
Counties In District
| Name | Count | Percent |
|---|
| San Francisco | 356,496 | 40.74% |
|---|
| San Mateo | 147,376 | 19.25% |
|---|
Places In District
| Name | Count | Percent |
|---|
| SAN FRANCISCO: San Francisco(C) | 356,496 | 40.74% |
|---|
| SAN MATEO: Broadmoor(U) | 4,415 | 100.00% |
|---|
| SAN MATEO: Colma(C) | 1,510 | 100.00% |
|---|
| SAN MATEO: Daly City(C) | 105,024 | 100.00% |
|---|
| SAN MATEO: San Bruno(C) | 1,865 | 4.24% |
|---|
| SAN MATEO: South San Francisco(C) | 32,960 | 49.80% |
|---|
| SAN MATEO: Remainder of San Mateo(R) | 1,602 | 9.12% |
|---|
